How Much Does Modeling Cost? AI Inference Prices Explained
How Much Does Modeling Cost in 2026? Current AI per-token and per-job prices, a monthly bill formula, and the hidden costs that change it.
Frontier model creation and everyday model usage have very different economics: Epoch AI's training-cost analysis estimates that hardware accounts for 47%–67% of frontier-model development costs, while energy represents only 2%–6%. For application developers, though, the relevant question isn't what a model cost to build. It's what you'll pay to complete a useful task, including the requests that need another attempt.
Table of Contents
- Current Prices for Text, Image and Video Models
- How to Estimate a Monthly Model Bill
- Factors That Change What Inference Costs
- Why Cheaper Tokens Can Still Mean Higher Bills
- How Reliability and Infrastructure Shift Real Cost
- Set Your Budget Before You Commit to a Model
Current Prices for Text, Image and Video Models
How much does modeling cost? For AI inference, the answer starts with the billing unit: text uses input and output tokens, images use images or megapixels, and video can use jobs. This article covers usage prices for inference, not training budgets. Stanford's reported estimate for Gemini 1.0 Ultra training was $192 million, according to Voronoi's presentation of the AI Index estimate, but API customers don't pay that development cost directly.
The historical trend is striking. The Stanford 2025 AI Index measured the cost of querying a system achieving GPT-3.5-level performance on MMLU falling from approximately $20 per million tokens in November 2022 to $0.07 by October 2024. That's a benchmark-specific comparison, not a current quote for every capable model.
Current per-unit prices by model type
UberLLM lists live per-model API prices for 254 models, including GPT, Claude, Gemini, DeepSeek, GLM, Qwen, Llama, Mistral and Kimi. Chat prices separate input from output.
| Model | Billing unit | UberLLM price | List price |
|---|---|---|---|
| Claude Opus 5.5, input | Per 1M input tokens | $2.03 | $4.00 |
| Claude Opus 5.5, output | Per 1M output tokens | $10.13 | $20.00 |
| Kimi K3, input | Per 1M input tokens | $0.003 | $0.19 |
| Kimi K3, output | Per 1M output tokens | $0.23 | $15.00 |
| FLUX 2 Pro image | Per image | $0.0075 | $0.03 |
| Nano Banana 2 image | Per image | $0.015 | $0.10 |
| FLUX.2 Klein 4B image | Per megapixel | $0.00015 | $0.015 |
| Veo 3.1 Full text-to-video | Per job | $0.22 | $0.44 |
| Kling 3 Standard image-to-video | Per job | $0.063 | $0.084 |
| LTX 2.3 Fast text-to-video | Per job | $0.045 | $0.06 |
| Runway Gen-4 Turbo | Per job | $0.0675 | No verified list price available |
Use the video API pricing comparison to check the live job offering before estimating media spend. A job price is meaningful only alongside the output configuration you intend to request.
The listed price is what a request typically costs, not a ceiling. Read each row by identifying the unit your feature consumes, then multiply that unit by expected usage. Don't compare a megapixel price directly with a per-image price without accounting for the image dimensions.
How to Estimate a Monthly Model Bill
Build the estimate around product features, not a single blended token allowance. A support conversation, document extraction and video preview consume different resources, so combining them too early hides which feature needs attention.
The calculation begins with volume and measured usage.
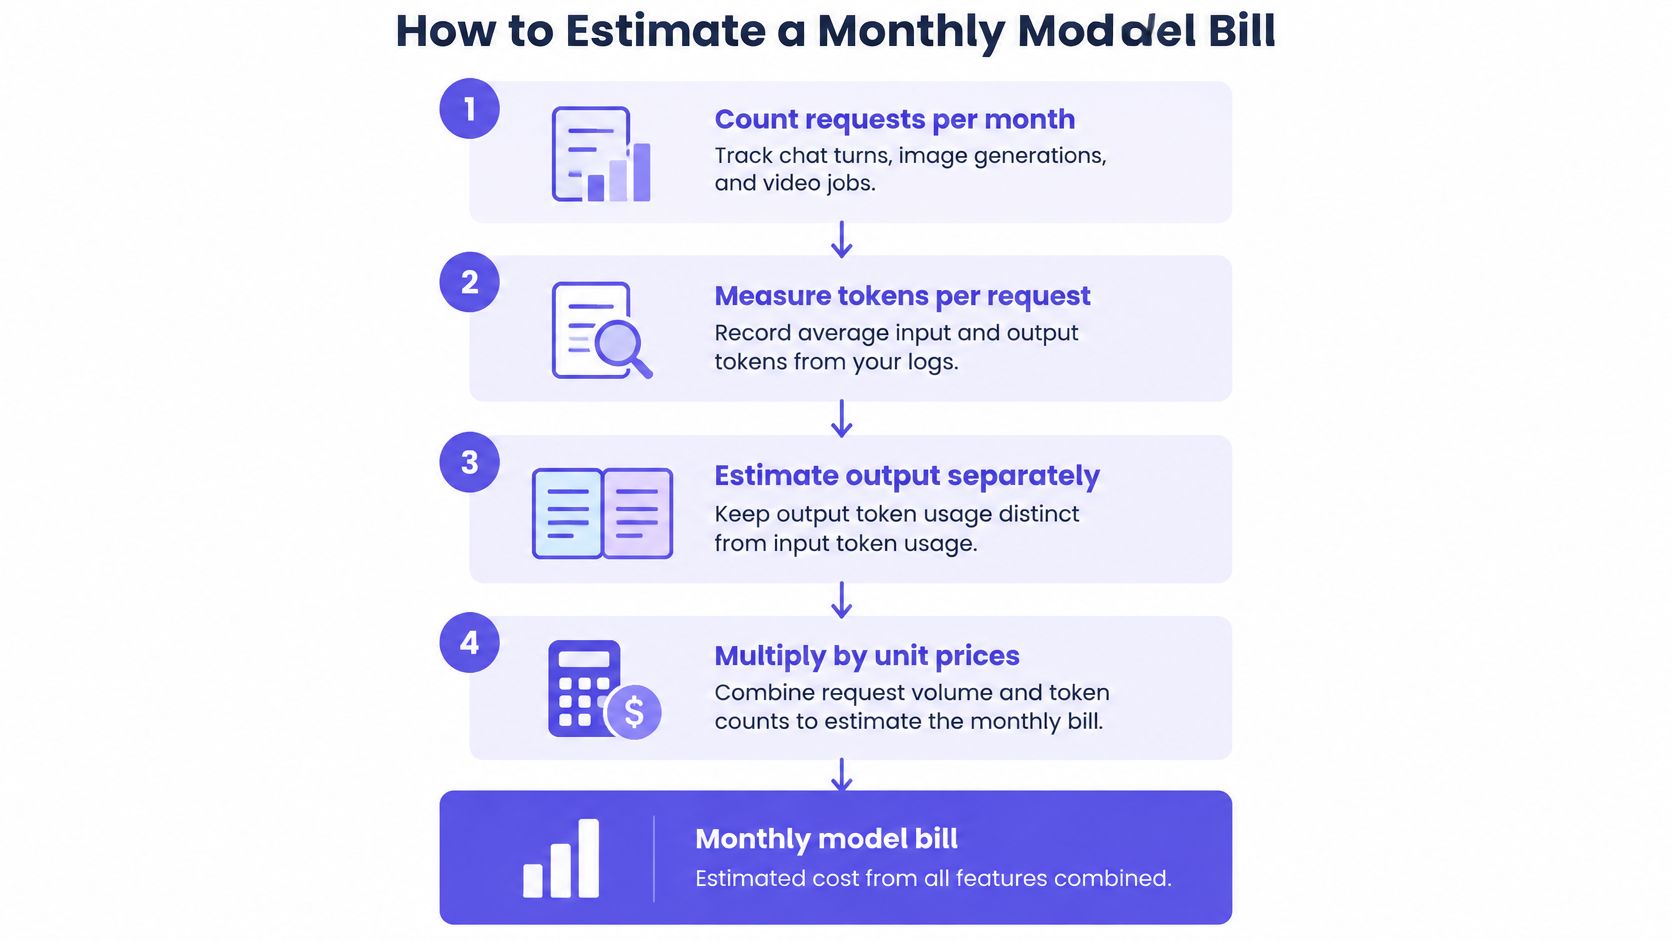
Count requests by feature. Record chat turns, document-processing calls, image generations and video jobs separately. Include background calls, not just actions visible to users.
Measure input and output independently. Capture actual token counts from response usage fields and logs. Include system instructions, conversation history, retrieved passages and tool results in the input measurement.
Apply the exact model's rates. Multiply monthly input tokens by the input rate and monthly output tokens by the output rate, using the billing denominator shown in the catalog. Record the model identifier beside each calculation so a model change doesn't invalidate the forecast.
Add media units. Multiply image, megapixel and video-job volume by their matching prices. Keep configuration-specific jobs separate rather than averaging unrelated outputs.
Include extra attempts. Distinguish application retries, rejected-but-successfully-generated answers and provider failures. Our failed requests or generations aren't charged, but a delivered answer that your application rejects still represents work your workflow consumed.
Account for funding costs. We add no fee on top of listed model prices, and there's no monthly fee or minimum. Card balance additions carry a disclosed 5.5% plus $0.50 fee, so keep that funding charge separate from request spending.
Turn the estimate into a usable budget
The basic text calculation is:
Monthly text spend = input-token charges + output-token charges across all attempts.
Then add media spending and any supporting application services. The guide to AI pricing models helps distinguish billing structures before you combine them.
Our published monthly example totals $113.00, compared with $400.00 on OpenRouter or at official prices, a $287.00 difference. Treat that as an example workload, not a prediction for an application with a different model mix or output volume.
Budgeting rule: Keep a monthly total for each feature, an average cost per request and a separate allowance for uncertainty. A single account total can't explain why spending changed.
Factors That Change What Inference Costs
A model call resembles a taxi fare: distance alone doesn't determine the bill if waiting time also matters. For inference, token volume is only part of the calculation; workload shape and serving requirements affect the resources needed to deliver the answer.
Cost factors and what each one does to the bill
| Factor | Effect on cost | What to do |
|---|---|---|
| Output length | Longer responses consume more billed output | Cap output and request concise formats |
| Model tier | Higher capability can carry a higher token price | Test the least expensive model that meets your quality bar |
| Context length | Long retrieval contexts increase memory traffic and reduce throughput | Send only relevant retrieved passages |
| Quantization | Lower precision can improve throughput but affect quality | Evaluate the deployed precision on representative tasks |
| Billing unit | Images, megapixels and video jobs measure different outputs | Match the unit to your product's deliverable |
| Latency tier | Capacity suitable for interactive work can command a premium | Match serving requirements to user tolerance |
| Failed generations | Additional attempts consume time and may create billable work | Separate provider failures from application-level rejection |
A consumer-GPU inference study estimated electricity-only costs of $0.001–$0.005 per million tokens for ordinary API workloads, versus $0.14–$0.22 for retrieval-augmented generation with 32K context, and reported that NVFP4 delivered about 1.6 times BF16 throughput with 41% less energy and an estimated 2%–4% quality loss.
Those are electricity-only operating estimates, not customer API prices. They exclude the rest of the serving business, and they aren't directly comparable with the billed input and output rates in the price table.
Self-hosting needs its own calculation
A LLaMA inference benchmark found that serving a 65B model required roughly 8–32 GPUs, with reported inference power consumption of about 300 watts to 1 kilowatt, depending on sharding configuration. Self-hosting therefore needs a utilization calculation, not just an electricity estimate: include hardware, memory, networking, operations and idle capacity.
Use the model-price change tracker when reviewing alternatives. We let you switch models by changing the model ID, but compatibility doesn't establish equivalent quality.
Choose the cheapest model that passes your own evaluation, then reduce unnecessary context and output before negotiating a lower rate.
Why Cheaper Tokens Can Still Mean Higher Bills
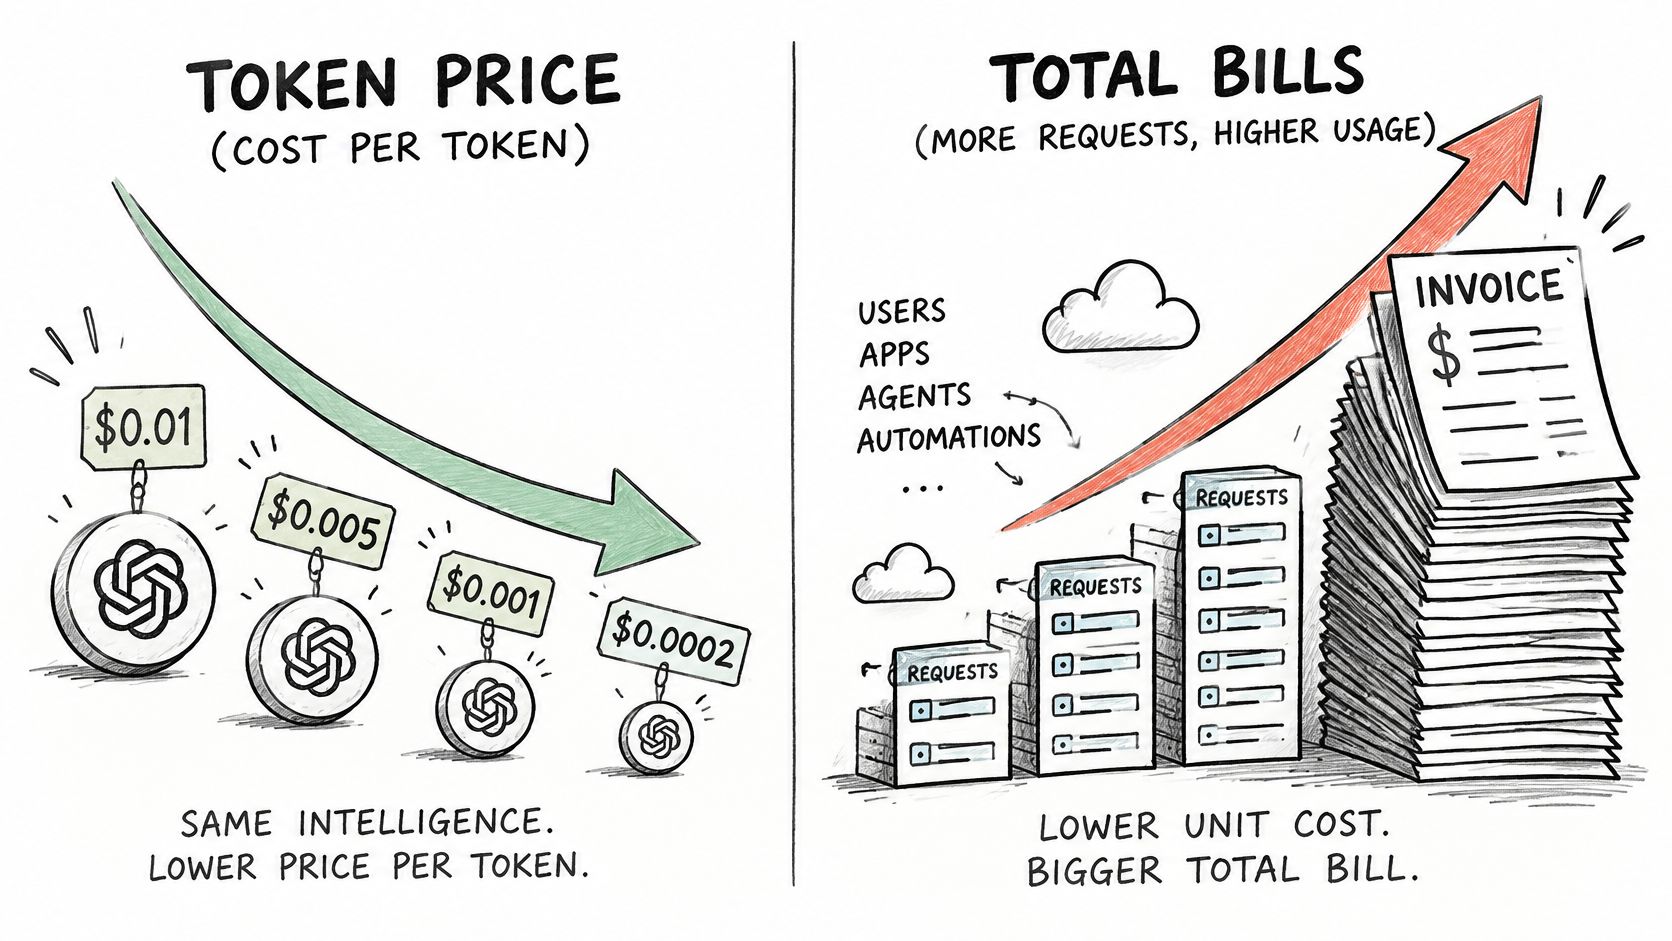
One estimate in TCS's analysis of outcome-based generative AI spending reports that per-token costs declined roughly 1,000-fold over three years while total inference spending continued to rise, and notes that output tokens commonly cost three to six times more than input tokens. Lower unit prices don't guarantee lower application spending.
The distinction is easier to see when price and usage move in opposite directions.
Compare completed work, not isolated generations
Consider an illustrative document-extraction workflow. The lower-priced model produces a verbose explanation instead of the required structured response, so your application submits a repair request. If the repaired response still fails validation, the workflow escalates to a stronger model.
The alternative model costs more per output token but returns an acceptable structured result immediately. Its higher unit rate can produce a lower total task cost because you avoid the repair prompt, the repeated document context and the fallback generation.
That outcome isn't inevitable. It's precisely what a representative evaluation should determine.
Cost per completed task = total workflow spending ÷ successfully completed tasks.
Include retrieval, tool calls, guardrails and human escalation when they belong to that workflow. Define success before measuring: an answer that arrived isn't necessarily an answer your product can use.
This distinction also matters when interpreting broader discussions of AI economics.
Diagnose the expensive path
Track prompt length, output length, validation failures and fallback decisions alongside spending. A cheap first attempt can remain worthwhile if it resolves routine cases and escalates difficult ones selectively. It becomes wasteful when nearly every task pays for both the initial attempt and the fallback.
Don't remove quality checks just to improve the apparent success rate. That changes the definition of success rather than reducing the cost of useful work.
Decision test: What will an accepted workflow cost after long outputs, retries and supporting services, not merely after its first model call?
How Reliability and Infrastructure Shift Real Cost
A headline price doesn't establish that suitable capacity will be available when your application needs it. Region, commitment, latency requirements and capacity type all affect the comparison.
A GPU pricing and inference-cost tracker reported H100 prices from about $0.34 per hour on spot instances to roughly $3.46 per hour on average, alongside an estimate of $0.50–$3 per million output tokens for comparable-capability serving across providers, latency tiers and context windows. Those ranges describe different purchasing conditions, not interchangeable offers.
Batch work and interactive work need different capacity
For batch processing, an inexpensive endpoint may be acceptable even when completion times fluctuate. A document-classification queue can pause or reschedule work if the application tracks job state and prevents duplicate processing. Paying extra for immediate responses may add little value.
For interactive products, the same endpoint may be a poor purchase. If users abandon a request before it finishes, technically successful generation can still fail commercially. A more expensive endpoint can be worthwhile when it reduces timeout-related retries, abandoned sessions or support interventions.
Compare both options under representative concurrency. Measure time to first token, completion latency, tail latency and accepted-task completion, rather than relying on an idle-endpoint test.
Routing changes the operational comparison
We route each request to the cheapest healthy seller and move it to another healthy seller when a provider becomes slow or unavailable. That reduces the need for your application to implement every seller-specific recovery path, but you should still test end-to-end behavior.
If no provider can serve a model, the API returns 503 no_available_provider, and nothing is charged. For video, the reply states the most the job can cost before generation starts. Neither behavior eliminates the need to handle unavailable capacity or delayed results in your product.
Set these values before comparing endpoints:
- Availability target: Define when a feature must work and what degraded behavior is acceptable.
- Latency target: Specify the response time users need, including slow-tail behavior.
- Failover value: Decide which interruptions justify alternate capacity or another model.
- Task-cost ceiling: Set the maximum economically acceptable spend for an accepted result.
A useful procurement comparison holds those requirements constant. Otherwise, you're comparing different services through the same price column.
Set Your Budget Before You Commit to a Model
Commit to a model only after you can connect its price to a feature-level budget and a measurable acceptance test. A promising playground response is a starting point, not evidence that the entire workflow is economical.
Put controls around the evaluation
Choose each feature's billing unit. Record whether the deliverable consumes input tokens, output tokens, images, megapixels or jobs. Keep the requested configuration beside that unit so a change in image dimensions or video settings triggers a budget review.
Build a feature-level forecast. Use observed request volume and usage from a representative sample. Include the full execution path, including background processing and application-directed repair calls, rather than estimating from the user's visible prompt alone.
Send a price limit with requests. Use the applicable
max_priceormax_costcontrol. A request is never billed above the value you send, so an enforceable limit is more useful than assuming the typical catalog price is a guaranteed maximum.Allocate the shared balance deliberately. One balance covers text, image, video and music models. Maintain feature-level spending records so a media experiment doesn't obscure the funds needed for an established text workflow.
Evaluate an alternative model. Our API provides one key for every model at list price or less. Change the model identifier while keeping the task instructions and acceptance criteria stable, then compare the resulting deliverables rather than selecting whichever answer sounds most polished.
Run a bounded production pilot. Choose a review window that captures routine and difficult traffic. Compare measured cost per accepted task with your forecast before expanding access or increasing concurrency.
Investigate the difference before switching providers
Use the dashboard playground to compare outputs and adjust parameters before production integration. For extraction, inspect schema compliance and whether fields are supported by the document. For coding, evaluate whether the proposed change satisfies the task and passes the relevant checks.
When measured cost exceeds the forecast, check output length, retry behavior and context size first. Then inspect whether your application has changed the workload, such as attaching full conversation histories or repeatedly supplying the same documents. Don't assume a higher bill means the listed rate increased.
Open the live pricing table this week, identify the feature responsible for the largest share of your spend, and build its estimate from logged usage. Assign someone to review the first measured results against that forecast.
UberLLM offers a unified API and prepaid balance for accessing text, image, video and music models, with request-level price controls. Visit UberLLM to compare live model prices, choose a candidate for your highest-spend feature and test its cost per completed task before committing.